Accelerate your trading success rate by 50%.
We helps novice traders build consistency and discipline on their journey to becoming a pro trader.
4.7
4.7


Protect your mental capital.
Minimize emotional trading while improving clarity, consistency, and overall trading performance.

Protect your mental capital.
Minimize emotional trading while improving clarity, consistency, and overall trading performance.

One trading journal.
All markets.
Seamlessly log and discover your edge across stocks, crypto, and futures markets.

Trade analytics.
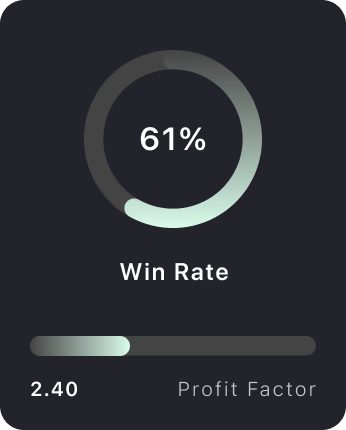
View win rate, fine-tune and develop strategies that are profitable.

Trade analytics.
View win rate, fine-tune and develop strategies that are profitable.

Manage risk.
Minimize losses.
Plan your risk-to-reward before trading. Assess potential drawdown and gains.

Manage risk.
Minimize losses.
Plan your risk-to-reward before trading. Assess potential drawdown and gains.


Calendar view.
Snapshot of daily and monthly trading performance with green vs red days and average PnL.
Reversal
Dragonfly Doji
RSI > 50
Head and Shoulders
Bullish MacD
Double Top
Support
Hammer
Double Bottom
Bull Flag
Bear Flag
Morning Star
Breakout
Three White Soldiers
Journal with tags.
Review and track behaviors, errors, or price action with custom tags and screenshots.
Reversal
Dragonfly Doji
RSI > 50
Head and Shoulders
Bullish MacD
Double Top
Support
Hammer
Double Bottom
Bull Flag
Bear Flag
Morning Star
Breakout
Three White Soldiers
Journal with tags.
Review and track behaviors, errors, or price action with custom tags and screenshots.
Reversal
Dragonfly Doji
RSI > 50
Head and Shoulders
Bullish MacD
Double Top
Support
Hammer
Double Bottom
Bull Flag
Bear Flag
Morning Star
Breakout
Three White Soldiers
Journal with tags.
Review and track behaviors, errors, or price action with custom tags and screenshots.
Bird's eye view.
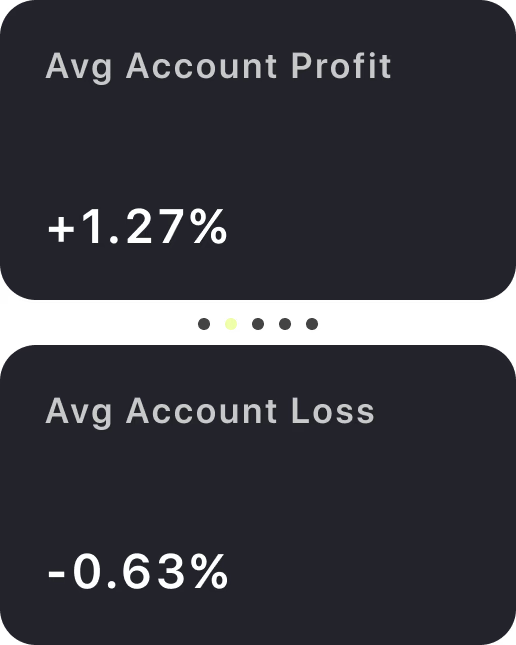
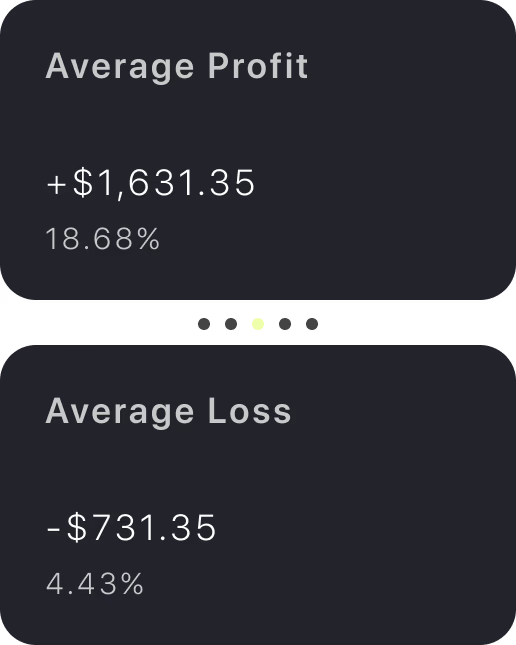
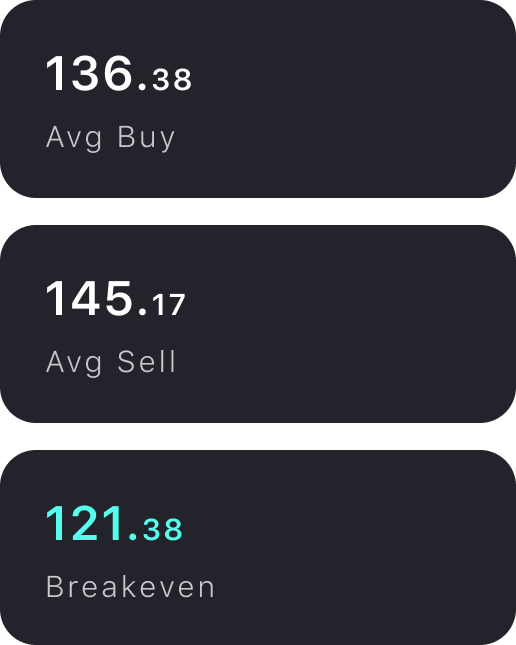
Comprehensive insights of all your trades. Leaprr provides detailed analytics that help traders understand their performance.
Bird's eye view.
Comprehensive insights of all your trades. Leaprr provides detailed analytics that help traders understand their performance.
What traders are saying.
Traders everywhere count on Leaprr to stay consistent and profitable in every market condition.

Alice
“Easy to use and great design. Clear and accurate stats.”

Hammer0422
“Excellent app to keep record of daily trades”

Rik445
“Great for improving consistency. Highly recommended!”

Jim
“Features are much better than comparable apps.”

Anntek
“Very useful to keep track of all my portfolio.”

Oliver
“Helped keep me discipline and focused”

Ryan
“Turned my struggles into steady progress. Great for novice traders”

Alice
“Easy to use and great design. Clear and accurate stats.”

Hammer0422
“Excellent app to keep record of daily trades”

Rik445
“Great for improving consistency. Highly recommended!”

Jim
“Features are much better than comparable apps.”

Anntek
“Very useful to keep track of all my portfolio.”

Oliver
“Helped keep me discipline and focused”

Ryan
“Turned my struggles into steady progress. Great for novice traders”
What traders are saying.
Traders everywhere count on Leaprr to stay consistent and profitable in every market condition.

Alice
“Easy to use and great design. Clear and accurate stats.”

Hammer0422
“Excellent app to keep record of daily trades”

Rik445
“Great for improving consistency. Highly recommended!”

Jim
“Features are much better than comparable apps.”

Anntek
“Very useful to keep track of all my portfolio.”

Oliver
“Helped keep me discipline and focused”

Ryan
“Turned my struggles into steady progress. Great for novice traders”
Get off to a good start.
Our mission is to empower traders to achieve consistency and profitability by providing valuable features at an excellent price.
Starter
$0
Free forever
Includes:
5 records per month
1 trading Journal
All insights
Starter
$0
Free forever
Includes:
5 records per month
1 trading Journal
All insights
Pro Monthly
$9.99
USD
Per month
Includes:
Unlimited records
10 trading Journals
All insights
Scale in and out
Add screenshots
Export records
Ad-free
Pro Monthly
$9.99
USD
Per month
Includes:
Unlimited records
10 trading Journals
All insights
Scale in and out
Add screenshots
Export records
Ad-free
Pro Yearly
$29.99
USD
Per year
Includes:
Unlimited records
10 trading Journals
All insights
Scale in and out
Add screenshots
Export records
Ad-free
Pro Yearly
$29.99
USD
Per year
Includes:
Unlimited records
10 trading Journals
All insights
Scale in and out
Add screenshots
Export records
Ad-free
Pro plans can be purchased on the Apple App store or Google Play store.
Your questions answered.
Feel free to reach out if you have any more questions or if you'd like to share your suggestions.
Why use Leaprr?
Unlike any other trading journal, we focus on functionalities to help retail traders develop the mindset needed to become consistent and profitable.
Will Leaprr help me thrive as a trader?
Building a profitable trading process with solid trading behavior is essential. We provide tools to help you stay on top of your game and drive success.
Consistency is key to avoiding account destruction and safeguarding your mental capital.
What insights are available?
We offer comprehensive trading insights in our journal, focusing on tools that help traders stay consistent and develop good habits.
Is Leaprr free to use?
Yes, registered users can log up to 5 positions per month with all the trading insights for free.
For unlimited logging, we offer monthly and yearly subscriptions.
Discover the latest in trading.
Explore expert trading tips, strategies, and insights in our blog. Whether you're a beginner or pro, find actionable advice to elevate your trading game!


